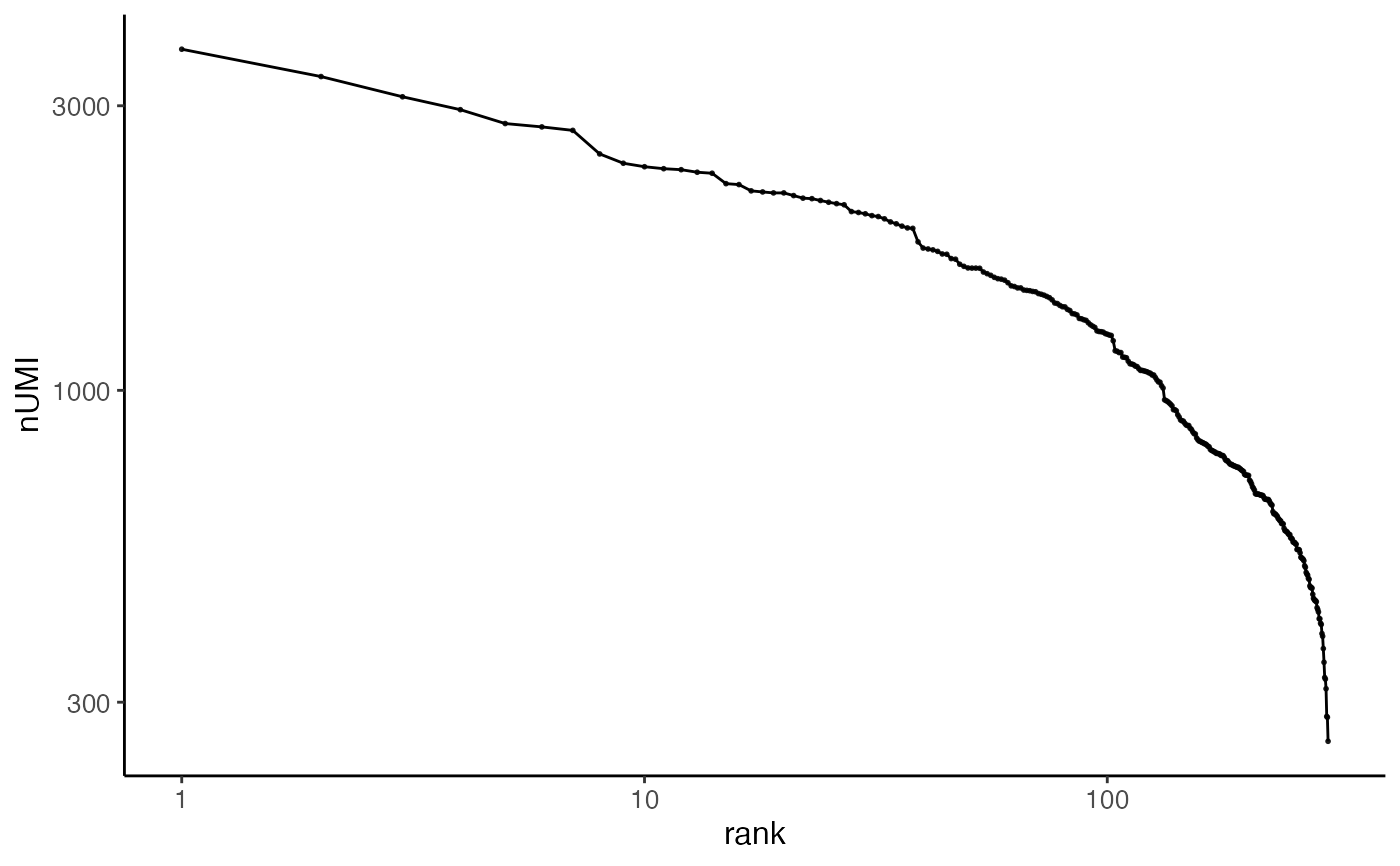
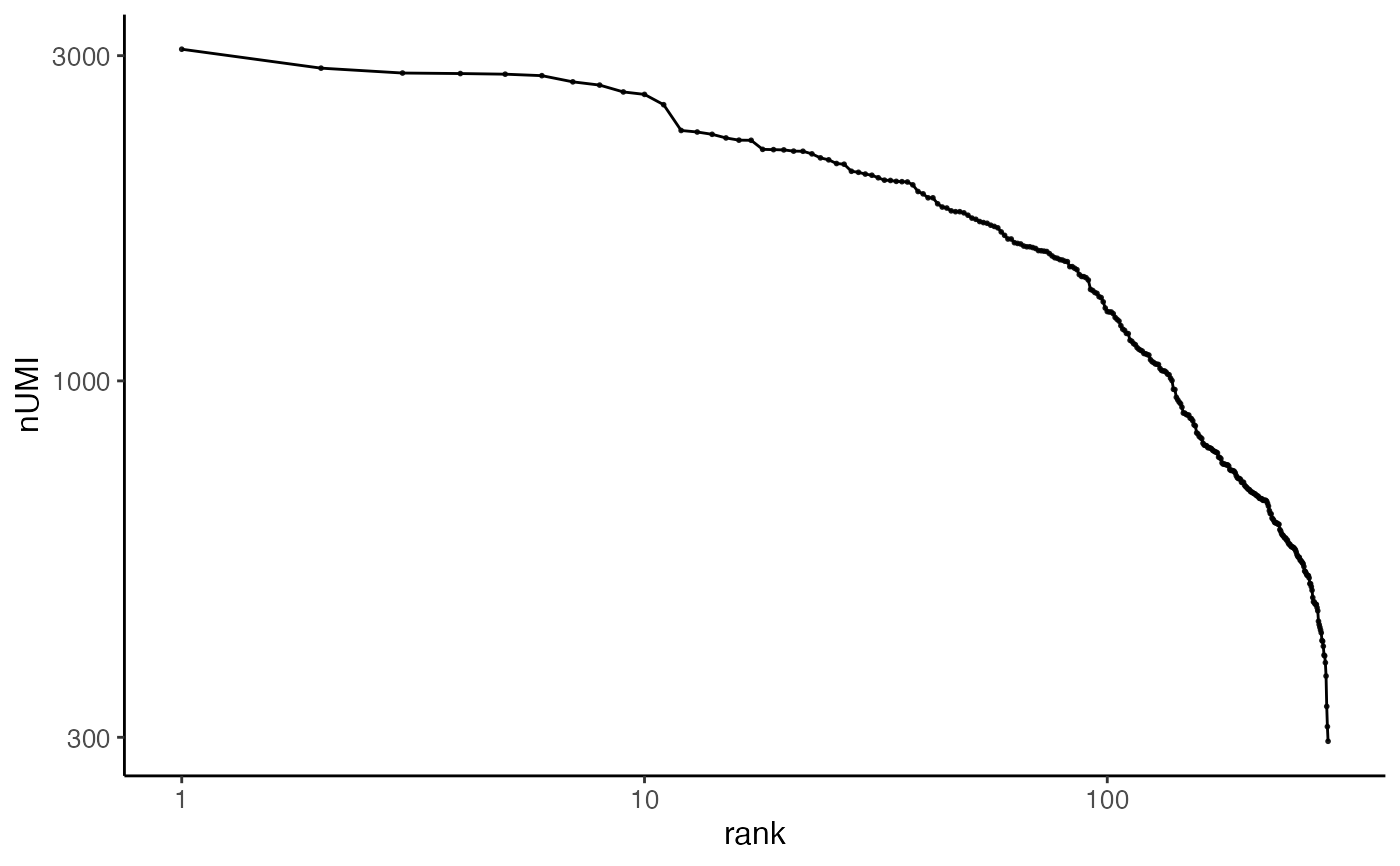
This function ranks the total count of each cell within each dataset and make line plot. This function is simply for examining the input raw count data and does not infer any recommended cutoff for removing non-cell barcodes.
Arguments
- object
A liger object.
- ...
Arguments passed on to
.ggScatter,.ggplotLigerThemedotSize,dotAlphaNumeric, controls the size or transparency of all dots. Default
getOption("ligerDotSize")(1) and0.9.rasterLogical, whether to rasterize the plot. Default
NULLautomatically rasterize the plot when number of total dots to be plotted exceeds 100,000.title,subtitle,xlab,ylabMain title, subtitle or X/Y axis title text. By default, no main title or subtitle will be set, and X/Y axis title will be the names of variables used for plotting. Use
NULLto hide elements.TRUEforxlaborylabshows default values.baseSizeOne-parameter control of all text sizes. Individual text element sizes can be controlled by other size arguments. "Title" sizes are 2 points larger than "text" sizes when being controlled by this.
panelBorderWhether to show rectangle border of the panel instead of using ggplot classic bottom and left axis lines. Default
FALSE.plotlyWhether to use plotly to enable web based interactive browsing for the plot. Requires installation of package "plotly". Default
FALSE.