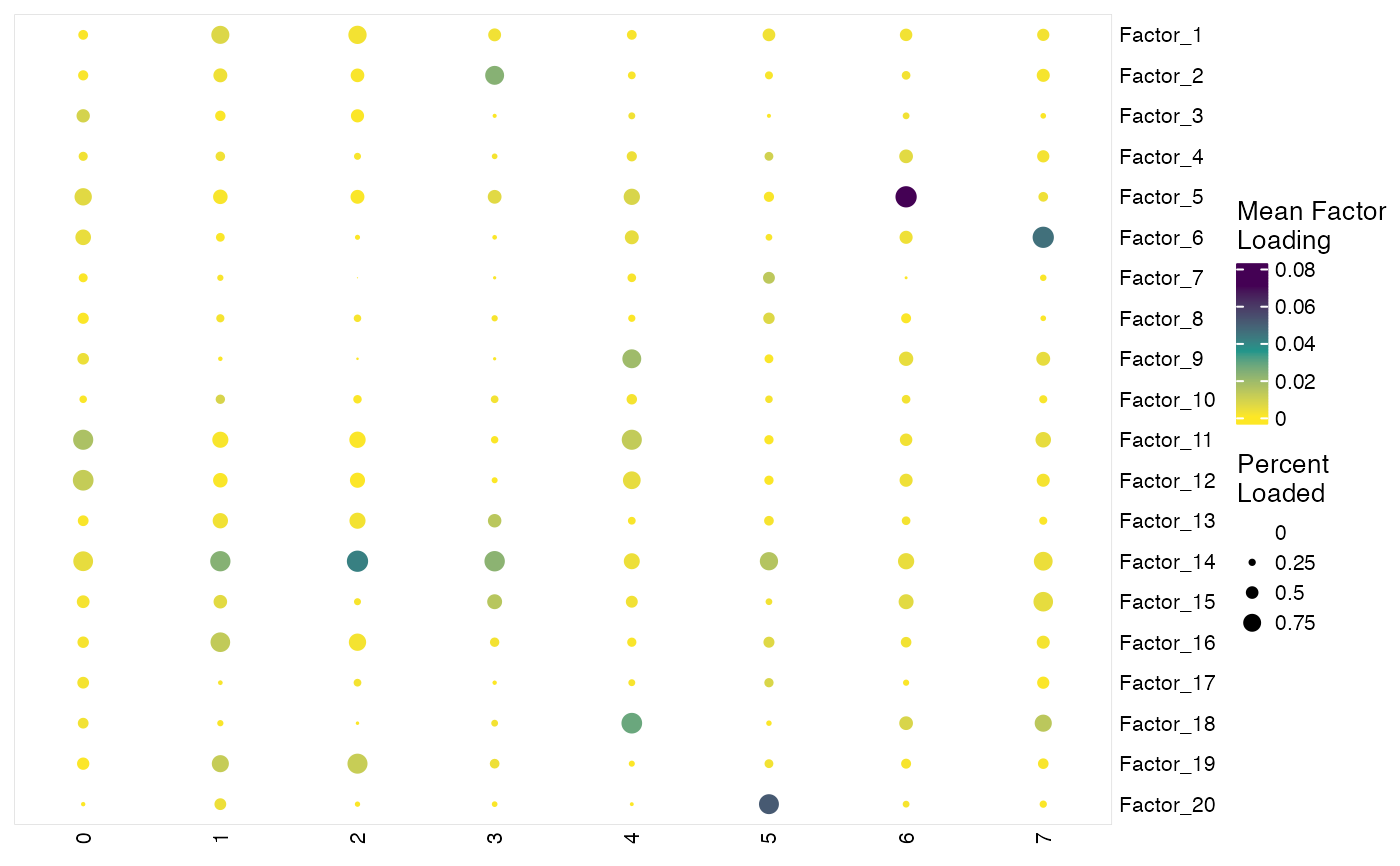
This function produces dot plots. Each column represent a group
of cells specified by groupBy, each row is a factor specified by
useDims. The color of dots reflects mean of factor loading of
specified factors in each cell group and sizes reflects the percentage of
cells that have loadings of a factor in a group. We utilize
ComplexHeatmap
for simplified management of adding annotation and slicing subplots. This was
inspired by the implementation in
scCustomize.
Usage
plotClusterFactorDot(
  object,
  groupBy = NULL,
  useDims = NULL,
  useRaw = FALSE,
  splitBy = NULL,
  factorScaleFunc = NULL,
  cellIdx = NULL,
  legendColorTitle = "Mean Factor\nLoading",
  legendSizeTitle = "Percent\nLoaded",
  viridisOption = "viridis",
  verbose = FALSE,
  ...
)
Arguments
- object
A liger object
- groupBy
The names of the columns in
cellMetaslot storing categorical variables. Loading data would be aggregated basing on these, together withsplitBy. Default uses default clusters.- useDims
A Numeric vector to specify exact factors of interests. Default
NULLuses all available factors.- useRaw
Whether to use un-aligned cell factor loadings (\(H\) matrices). Default
FALSE.- splitBy
The names of the columns in
cellMetaslot storing categorical variables. Dotplot panel splitting would be based on these. DefaultNULL.- factorScaleFunc
A function object applied to factor loading matrix for scaling the value for better visualization. Default
NULL.- cellIdx
Valid cell subscription. See
subsetLiger. DefaultNULLfor using all cells.- legendColorTitle
Title for colorbar legend. Default
"Mean Factor\nLoading".- legendSizeTitle
Title for size legend. Default
"Percent\nLoaded"- viridisOption
Name of available viridis palette. See
viridis. Default"viridis".- verbose
Logical. Whether to show progress information. Mainly when subsetting data. Default
FALSE.- ...
Additional theme setting arguments passed to
.complexHeatmapDotPlotand heatmap setting arguments passed toHeatmap. See Details.
Value
HeatmapList object.
Details
For ..., please notice that arguments colorMat,
sizeMat, featureAnnDF, cellSplitVar, cellLabels
and viridisOption from .complexHeatmapDotPlot are
already occupied by this function internally. A lot of arguments from
Heatmap have also been occupied: matrix,
name, heatmap_legend_param, rect_gp, col, layer_fun, km, border, border_gp,
column_gap, row_gap, cluster_row_slices, cluster_rows, row_title_gp,
row_names_gp, row_split, row_labels, cluster_column_slices, cluster_columns,
column_split, column_title_gp, column_title, column_labels, column_names_gp,
top_annotation.