Create violin plot for multiple genes grouped by clusters
Source:R/visualization.R
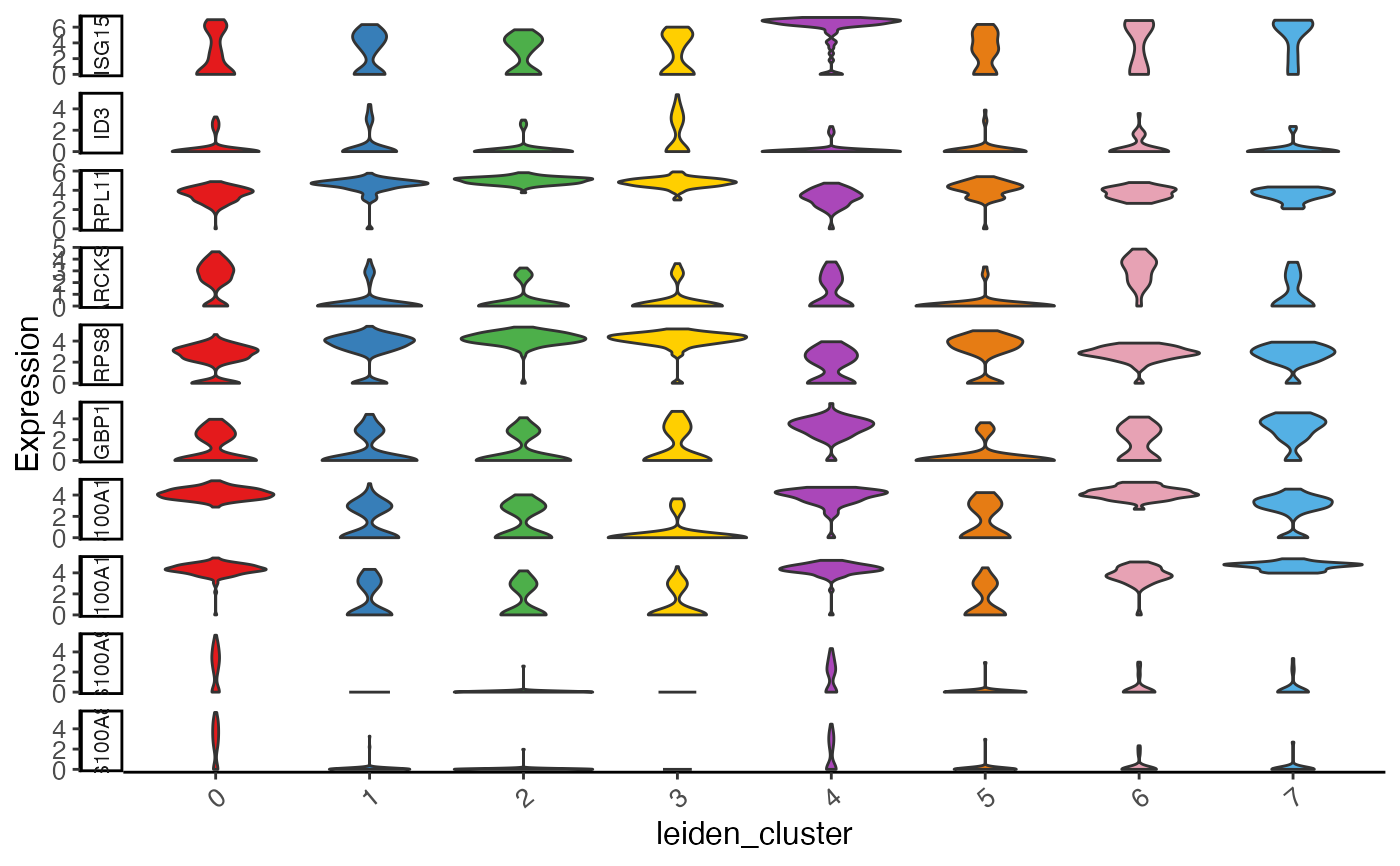
plotClusterGeneViolin.RdMake violin plots for each given gene grouped by cluster variable and stack along y axis.
Arguments
- object
A liger object.
- gene
Character vector of gene names.
- groupBy
The name of an available categorical variable in
cellMetaslot. This forms the main x-axis columns. UseFALSEfor no grouping. DefaultNULLlooks clustering result but will not group if no clustering is found.- colorBy
The name of another categorical variable in
cellMetaslot. This split the main grouping columns and color the violins. DefaultNULLwill not split and color the violins.- box
Logical, whether to add boxplot. Default
FALSE.- boxAlpha
Numeric, transparency of boxplot. Default
0.1.- yFunc
Function to transform the y-axis. Default is
log1p(x*1e4). Set toNULLfor no transformation.- showLegend
Whether to show the legend. Default
FALSE.- xlabAngle
Numeric, counter-clockwise rotation angle in degrees of X axis label text. Default
40.- ...
Arguments passed on to
.ggplotLigerThemetitle,subtitle,xlab,ylabMain title, subtitle or X/Y axis title text. By default, no main title or subtitle will be set, and X/Y axis title will be the names of variables used for plotting. Use
NULLto hide elements.TRUEforxlaborylabshows default values.legendFillTitleLegend title text for fill aesthetics, often used for violin, box, bar plots. Default
NULLshows the original variable name.legendPositionText indicating where to place the legend. Choose from
"top","bottom","left"or"right". Default"right".baseSizeOne-parameter control of all text sizes. Individual text element sizes can be controlled by other size arguments. "Title" sizes are 2 points larger than "text" sizes when being controlled by this.
titleSize,xTitleSize,yTitleSize,legendTitleSizeSize of main title, axis titles and legend title. Default
NULLcontrols bybaseSize + 2.subtitleSize,xTextSize,yTextSize,legendTextSizeSize of subtitle text, axis texts and legend text. Default
NULLcontrols bybaseSize.yFacetSizeSize of facet strip label text on y-axis. Default
NULLcontrols bybaseSize - 2.panelBorderWhether to show rectangle border of the panel instead of using ggplot classic bottom and left axis lines. Default
FALSE.colorLabelsCharacter vector for modifying category names in a color legend. Passed to
ggplot2::scale_color_manual(labels). DefaultNULLuses original levels of the factor.colorValuesCharacter vector of colors for modifying category colors in a color legend. Passed to
ggplot2::scale_color_manual(values). DefaultNULLuses internal selected palette when <= 26 categories are presented, otherwise ggplot hues.legendNRow,legendNColInteger, when too many categories in one variable, arranges number of rows or columns. Default
NULL, automatically split toceiling(levels(variable)/15)columns.plotlyWhether to use plotly to enable web based interactive browsing for the plot. Requires installation of package "plotly". Default
FALSE.
Details
If xlab need to be set, set xlabAngle at the same time. This is
due to that the argument parsing mechanism will partially match it to main
function arguments before matching the ... arguments.
Examples
plotClusterGeneViolin(pbmcPlot, varFeatures(pbmcPlot)[1:10])
#> ℹ Subsetting dataset: "ctrl"
#> ℹ Subsetting dataset: "stim"
#> ✔ Subsetting dataset: "stim" ... done
#>
#> ℹ Subsetting dataset: "ctrl"

#> ✔ Subsetting dataset: "ctrl" ... done
#>