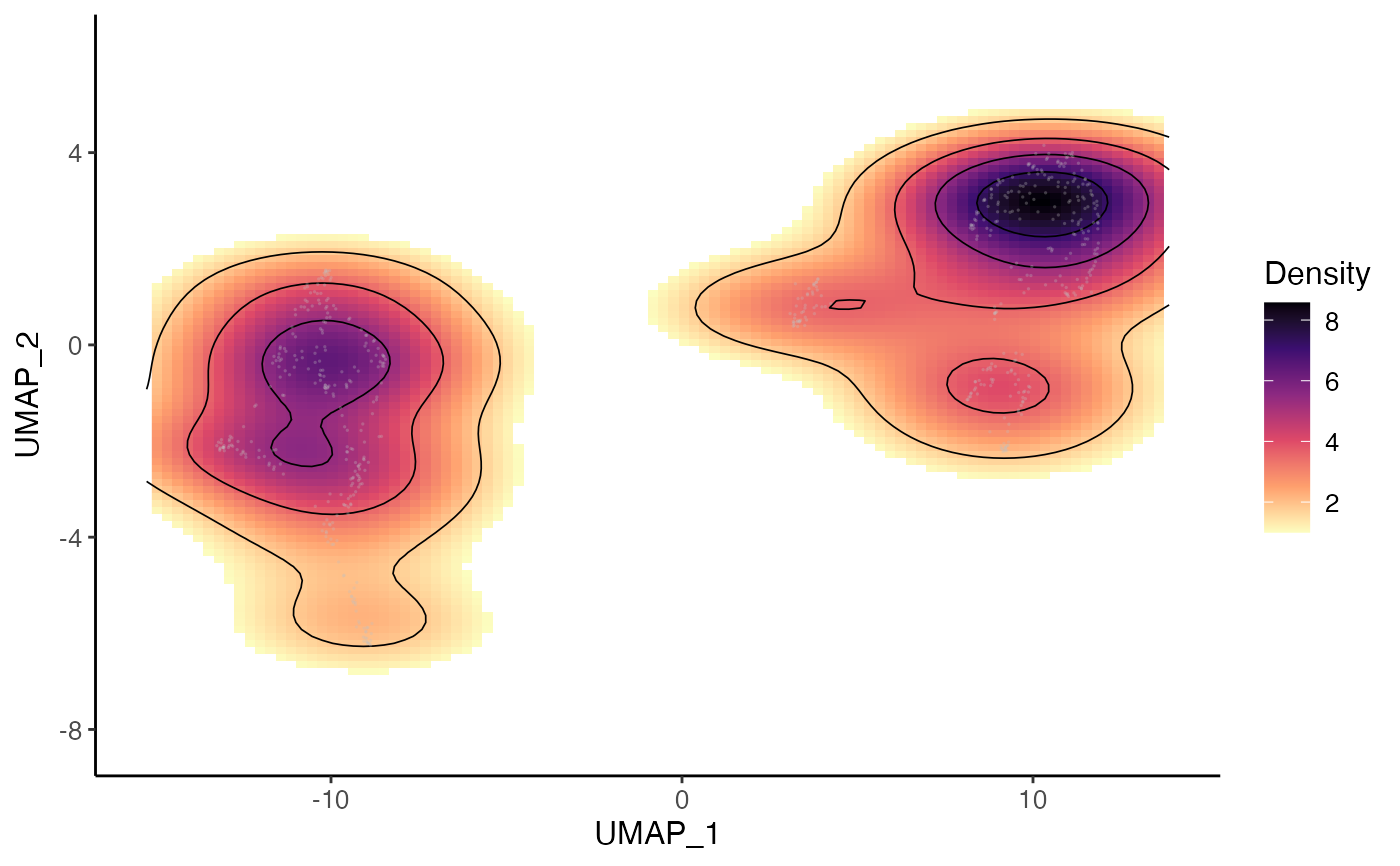
This function shows the cell density presented in a 2D
dimensionality reduction coordinates. Density is shown with coloring and
contour lines. A scatter plot of the dimensionality reduction is added as
well. The density plot can be splitted by categorical variables (e.g.
"dataset"), while the scatter plot will always be shown for all cells
in subplots as a reference of the global structure.
Usage
plotDensityDimRed(
  object,
  useDimRed = NULL,
  splitBy = NULL,
  combinePlot = TRUE,
  minDensity = 8,
  contour = TRUE,
  contourLineWidth = 0.3,
  contourBins = 5,
  dot = TRUE,
  dotColor = "grey",
  dotSize = 0.6,
  dotAlpha = 0.3,
  dotRaster = NULL,
  title = NULL,
  legendFillTitle = "Density",
  colorPalette = "magma",
  colorDirection = -1,
  ...
)
Arguments
- object
A liger object
- useDimRed
Name of the variable storing dimensionality reduction result in the
cellMetaslot. Default uses default dimension reduction.- splitBy
Character vector of categorical variable names in
cellMetaslot. Split all cells by groupings on this/these variable(s) to produce a density plot containing only the cells in each group. DefaultNULL.- combinePlot
Logical, whether to utilize
plot_gridto combine multiple plots into one. DefaultTRUEreturns combined ggplot.FALSEreturns a list of ggplot or a single ggplot when only one plot is requested.- minDensity
A positive number to filter out low density region colored on plot. Default
8. Setting zero will show density on the whole panel.- contour
Logical, whether to draw the contour line. Default
TRUE.- contourLineWidth
Numeric, the width of the contour line. Default
0.3.- contourBins
Number of contour bins. Higher value generates more contour lines. Default
5.- dot
Logical, whether to add scatter plot of all cells, even when density plot is splitted with
splitBy. DefaultTRUE.- dotColor, dotSize, dotAlpha
Numeric, controls the appearance of all dots. Default
"grey",0.6and0.3, respectively.- dotRaster
Logical, whether to rasterize the scatter plot. Default
NULLautomatically rasterizes the dots when number of total cells to be plotted exceeds 100,000.- title
Text of main title of the plots. Default
NULL. Length of character vector input should match with number of plots generated.- legendFillTitle
Text of legend title. Default
"Density".- colorPalette
Name of the option for
scale_fill_viridis_c. Default"magma".- colorDirection
Color gradient direction for
scale_fill_viridis_c. Default-1.- ...
Arguments passed on to
.ggplotLigerThemetitle,subtitle,xlab,ylabMain title, subtitle or X/Y axis title text. By default, no main title or subtitle will be set, and X/Y axis title will be the names of variables used for plotting. Use
NULLto hide elements.TRUEforxlaborylabshows default values.showLegendWhether to show the legend. Default
TRUE.legendPositionText indicating where to place the legend. Choose from
"top","bottom","left"or"right". Default"right".baseSizeOne-parameter control of all text sizes. Individual text element sizes can be controlled by other size arguments. "Title" sizes are 2 points larger than "text" sizes when being controlled by this.
titleSize,xTitleSize,yTitleSize,legendTitleSizeSize of main title, axis titles and legend title. Default
NULLcontrols bybaseSize + 2.subtitleSize,xTextSize,yTextSize,legendTextSizeSize of subtitle text, axis texts and legend text. Default
NULLcontrols bybaseSize.panelBorderWhether to show rectangle border of the panel instead of using ggplot classic bottom and left axis lines. Default
FALSE.plotlyWhether to use plotly to enable web based interactive browsing for the plot. Requires installation of package "plotly". Default
FALSE.
Value
A ggplot object when only one plot is generated, A ggplot object
combined with plot_grid when multiple plots and
combinePlot = TRUE. A list of ggplot when multiple plots and
combinePlot = FALSE.