Visualize factor expression and gene loading
Usage
plotGeneLoadings(
  object,
  markerTable,
  useFactor,
  useDimRed = NULL,
  nLabel = 15,
  nPlot = 30,
  ...
)

plotGeneLoadingRank(
  object,
  markerTable,
  useFactor,
  nLabel = 15,
  nPlot = 30,
  ...
)
Arguments
- object
A liger object with valid factorization result.
- markerTable
Returned result of
getFactorMarkers.- useFactor
Integer index for which factor to visualize.
- useDimRed
Name of the variable storing dimensionality reduction result in the
cellMetaslot. Default"UMAP".- nLabel
Integer, number of top genes to be shown with text labels. Default
15.- nPlot
Integer, number of top genes to be shown in the loading rank plot. Default
30.- ...
Arguments passed on to
plotDimRed,.ggScatter,.ggplotLigerThemecolorByFuncDefault
NULL. A function object that expects a vector/factor/data.frame retrieved bycolorByas the only input, and returns an object of the same size, so that the all color "aes" are replaced by this output. Useful when, for example, users need to scale the gene expression shown on plot.cellIdxCharacter, logical or numeric index that can subscribe cells. Missing or
NULLfor all cells.shapeByAvailable variable name in
cellMetaslot to look for categorical annotation to be reflected by dot shapes. DefaultNULL.titlesTitle text. A character scalar or a character vector with as many elements as multiple plots are supposed to be generated. Default
NULL.dotSize,dotAlphaNumeric, controls the size or transparency of all dots. Default
getOption("ligerDotSize")(1) and0.9.trimHigh,trimLowNumeric, limit the largest or smallest value of continuous
colorByvariable. DefaultNULL.rasterLogical, whether to rasterize the plot. Default
NULLautomatically rasterize the plot when number of total dots to be plotted exceeds 100,000.legendColorTitleLegend title text for color aesthetics, often used for categorical or continuous coloring of dots. Default
NULLshows the original variable name.legendShapeTitleLegend title text for shape aesthetics, often used for shaping dots by categorical variable. Default
NULLshows the original variable name.showLegendWhether to show the legend. Default
TRUE.legendPositionText indicating where to place the legend. Choose from
"top","bottom","left"or"right". Default"right".baseSizeOne-parameter control of all text sizes. Individual text element sizes can be controlled by other size arguments. "Title" sizes are 2 points larger than "text" sizes when being controlled by this.
titleSize,xTitleSize,yTitleSize,legendTitleSizeSize of main title, axis titles and legend title. Default
NULLcontrols bybaseSize + 2.subtitleSize,xTextSize,yTextSize,legendTextSizeSize of subtitle text, axis texts and legend text. Default
NULLcontrols bybaseSize.panelBorderWhether to show rectangle border of the panel instead of using ggplot classic bottom and left axis lines. Default
FALSE.colorPaletteFor continuous coloring, an index or a palette name to select from available options from ggplot
scale_brewerorviridis. Default"magma".colorDirectionChoose
1or-1. Applied whencolorPaletteis from Viridis options. Default-1use darker color for higher value, while1reverses this direction.naColorThe color code for
NAvalues. Default"#DEDEDE".scale_colour_gradient2. DefaultNULL.
Examples
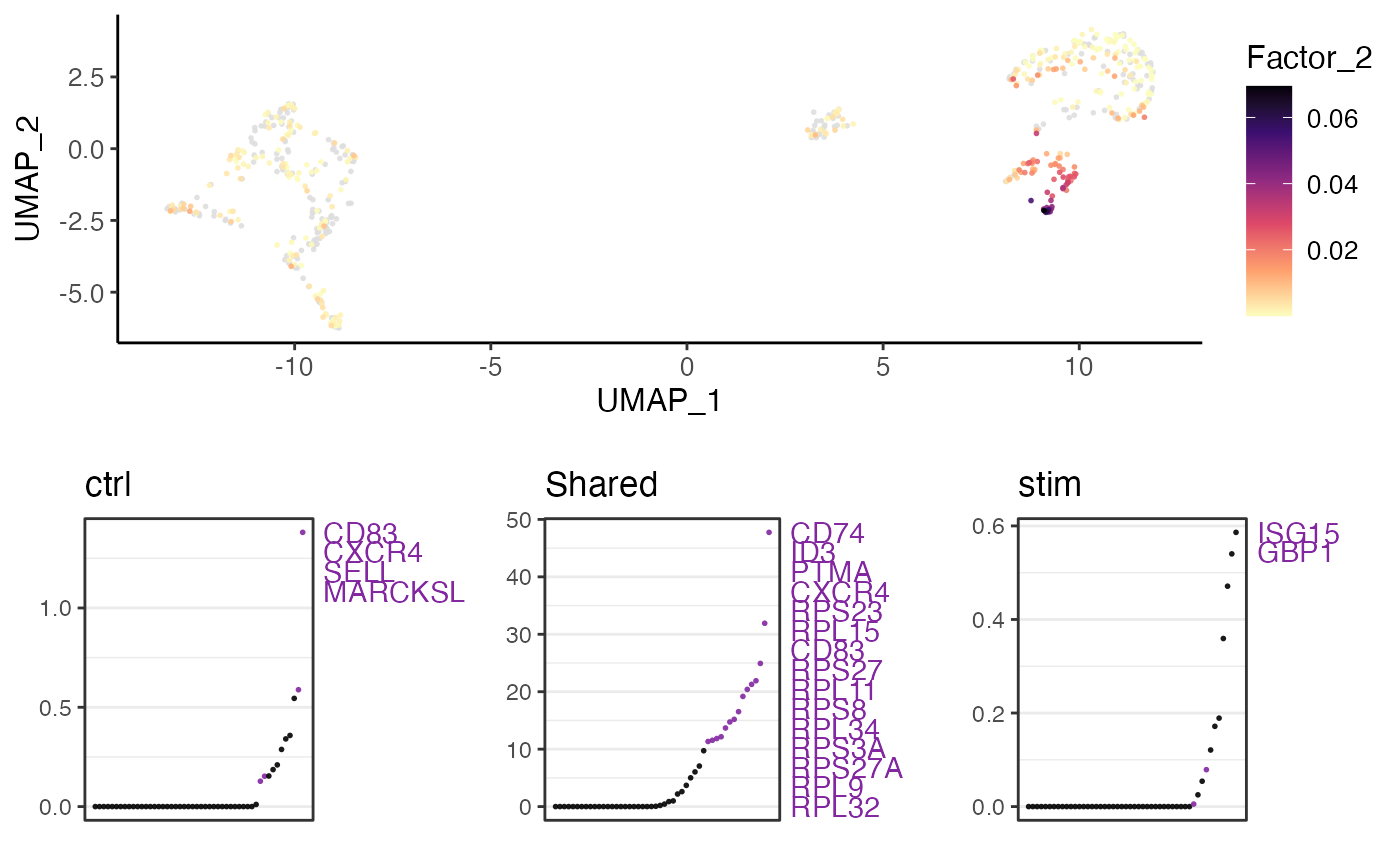
result <- getFactorMarkers(pbmcPlot, "ctrl", "stim")
#> ! Factor 7 did not appear as max in any cell in either dataset
#>
plotGeneLoadings(pbmcPlot, result, useFactor = 2)
#> ℹ Plotting feature "Factor_2" on 600 cells
#> ✔ Plotting feature "Factor_2" on 600 cells ... done
#>