Comprehensive group splited cluster plot on dimension reduction with proportion
Source:R/visualization.R
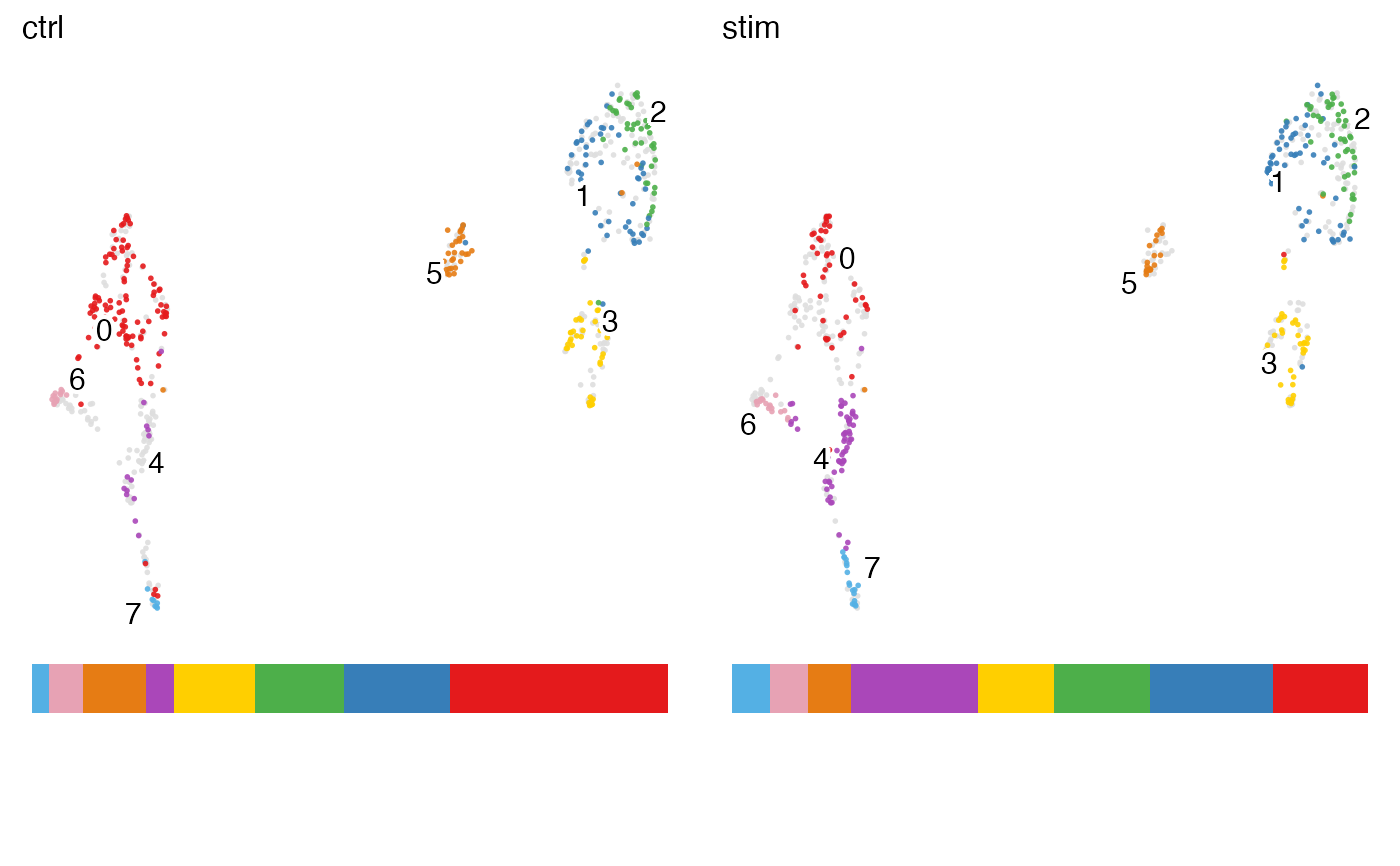
plotGroupClusterDimRed.RdThis function produces combined plot on group level (e.g. dataset, other metadata variable like biological conditions). Scatter plot of dimension reduction with cluster labeled is generated per group. Furthermore, a stacked barplot of cluster proportion within each group is also combined with the subplot of each group.
Arguments
- object
A liger object with dimension reduction, grouping variable and cluster assignment in
cellMeta(object).- useGroup
Variable name of the group division in metadata. Default
"dataset".- useCluster
Name of variable in
cellMeta(object). DefaultNULLuses default cluster.- useDimRed
Name of the variable storing dimensionality reduction result in
cellMeta(object). DefaultNULLuse default dimRed.- combinePlot
Whether to return combined plot. Default
TRUE. IfFALSE, will return a list containing only the scatter plots.- droplevels
Logical, whether to perform
droplevels()on the selected grouping variable. DefaultTRUEwill not show groups that are listed as categories but do not indeed have any cells.- relHeightMainLegend
Relative heights of the main combination panel and the legend at the bottom. Must be a numeric vector of 2 numbers. Default
c(5, 1).- relHeightDRBar
Relative heights of the scatter plot and the barplot within each subpanel. Must be a numeric vector of 2 numbers. Default
c(10, 1).- mainNRow, mainNCol
Arrangement of the main plotting region, for number of rows and columns. Default
NULLwill be automatically handled byplot_grid.- legendNRow
Arrangement of the legend, number of rows. Default
1.- ...
Arguments passed on to
.ggScatter,.ggplotLigerThemedotOrderControls the order that each dot is added to the plot. Choose from
"shuffle","ascending", or"descending". Default"shuffle", useful when coloring by categories that overlaps (e.g. "dataset"),"ascending"can be useful when coloring by a continuous variable (e.g. gene expression) where high values needs more highlight.NULLuse default order.dotSize,dotAlphaNumeric, controls the size or transparency of all dots. Default
getOption("ligerDotSize")(1) and0.9.rasterLogical, whether to rasterize the plot. Default
NULLautomatically rasterize the plot when number of total dots to be plotted exceeds 100,000.labelTextLogical, whether to show text label at the median position of each categorical group specified by
colorBy. DefaultTRUE. Does not work when continuous coloring is specified.labelTextSizeNumeric, controls the size of label size when
labelText = TRUE. Default4.seedRandom seed for reproducibility. Default
1.baseSizeOne-parameter control of all text sizes. Individual text element sizes can be controlled by other size arguments. "Title" sizes are 2 points larger than "text" sizes when being controlled by this.
panelBorderWhether to show rectangle border of the panel instead of using ggplot classic bottom and left axis lines. Default
FALSE.colorValuesCharacter vector of colors for modifying category colors in a color legend. Passed to
ggplot2::scale_color_manual(values). DefaultNULLuses internal selected palette when <= 26 categories are presented, otherwise ggplot hues.naColorThe color code for
NAvalues. Default"#DEDEDE".scale_colour_gradient2. DefaultNULL.plotlyWhether to use plotly to enable web based interactive browsing for the plot. Requires installation of package "plotly". Default
FALSE.