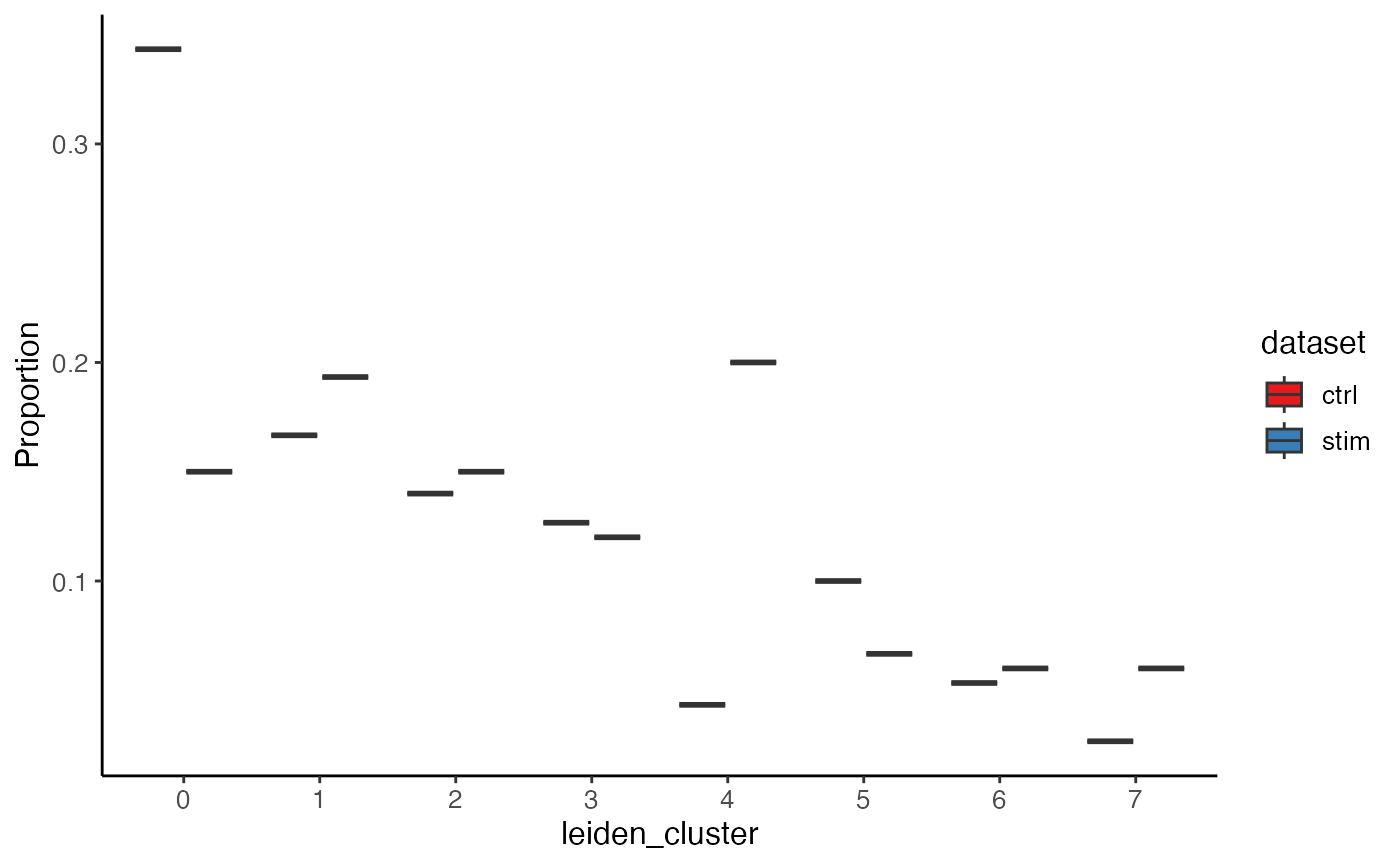
Box plot of cluster proportion in each dataset, grouped by condition
Source:R/visualization.R
plotProportionBox.RdThis function calculate the proportion of each category (e.g. cluster, cell type) within each dataset, and then make box plot grouped by condition. The proportion of all categories within one dataset sums up to 1. The condition variable must be a variable of dataset, i.e. each dataset must belong to only one condition.
Usage
plotProportionBox(
  object,
  useCluster = NULL,
  conditionBy = NULL,
  sampleBy = "dataset",
  splitByCluster = FALSE,
  dot = FALSE,
  dotSize = getOption("ligerDotSize", 1),
  dotJitter = FALSE,
  ...
)
Arguments
- object
A liger object.
- useCluster
Name of variable in
cellMeta(object). DefaultNULLuses default cluster.- conditionBy
Name of the variable in
cellMeta(object)that represents the condition. Must be a high level variable of thesampleByvariable, i.e. each sample must belong to only one condition. DefaultNULLdoes not group samples by condition.- sampleBy
Name of the variable in
cellMeta(object)that represents individual samples. Default"dataset".- splitByCluster
Logical, whether to split the wide grouped box plot by cluster, into a list of boxplots for each cluster. Default
FALSE.- dot
Logical, whether to add dot plot on top of the box plot. Default
FALSE.- dotSize
Size of the dot. Default uses user option "ligerDotSize", or
1if not set.- dotJitter
Logical, whether to jitter the dot to avoid overlapping within a box when many dots are presented. Default
FALSE.- ...
Arguments passed on to
.ggplotLigerThemetitle,subtitle,xlab,ylabMain title, subtitle or X/Y axis title text. By default, no main title or subtitle will be set, and X/Y axis title will be the names of variables used for plotting. Use
NULLto hide elements.TRUEforxlaborylabshows default values.legendFillTitleLegend title text for fill aesthetics, often used for violin, box, bar plots. Default
NULLshows the original variable name.showLegendWhether to show the legend. Default
TRUE.legendPositionText indicating where to place the legend. Choose from
"top","bottom","left"or"right". Default"right".baseSizeOne-parameter control of all text sizes. Individual text element sizes can be controlled by other size arguments. "Title" sizes are 2 points larger than "text" sizes when being controlled by this.
titleSize,xTitleSize,yTitleSize,legendTitleSizeSize of main title, axis titles and legend title. Default
NULLcontrols bybaseSize + 2.subtitleSize,xTextSize,yTextSize,legendTextSizeSize of subtitle text, axis texts and legend text. Default
NULLcontrols bybaseSize.panelBorderWhether to show rectangle border of the panel instead of using ggplot classic bottom and left axis lines. Default
FALSE.colorLabelsCharacter vector for modifying category names in a color legend. Passed to
ggplot2::scale_color_manual(labels). DefaultNULLuses original levels of the factor.colorValuesCharacter vector of colors for modifying category colors in a color legend. Passed to
ggplot2::scale_color_manual(values). DefaultNULLuses internal selected palette when <= 26 categories are presented, otherwise ggplot hues.legendNRow,legendNColInteger, when too many categories in one variable, arranges number of rows or columns. Default
NULL, automatically split toceiling(levels(variable)/10)columns.colorPaletteFor continuous coloring, an index or a palette name to select from available options from ggplot
scale_brewerorviridis. Default"magma".colorDirectionChoose
1or-1. Applied whencolorPaletteis from Viridis options. Default-1use darker color for higher value, while1reverses this direction.colorLow,colorMid,colorHigh,colorMidPointAll four of these must be specified to customize palette with
naColorThe color code for
NAvalues. Default"#DEDEDE".scale_colour_gradient2. DefaultNULL.plotlyWhether to use plotly to enable web based interactive browsing for the plot. Requires installation of package "plotly". Default
FALSE.