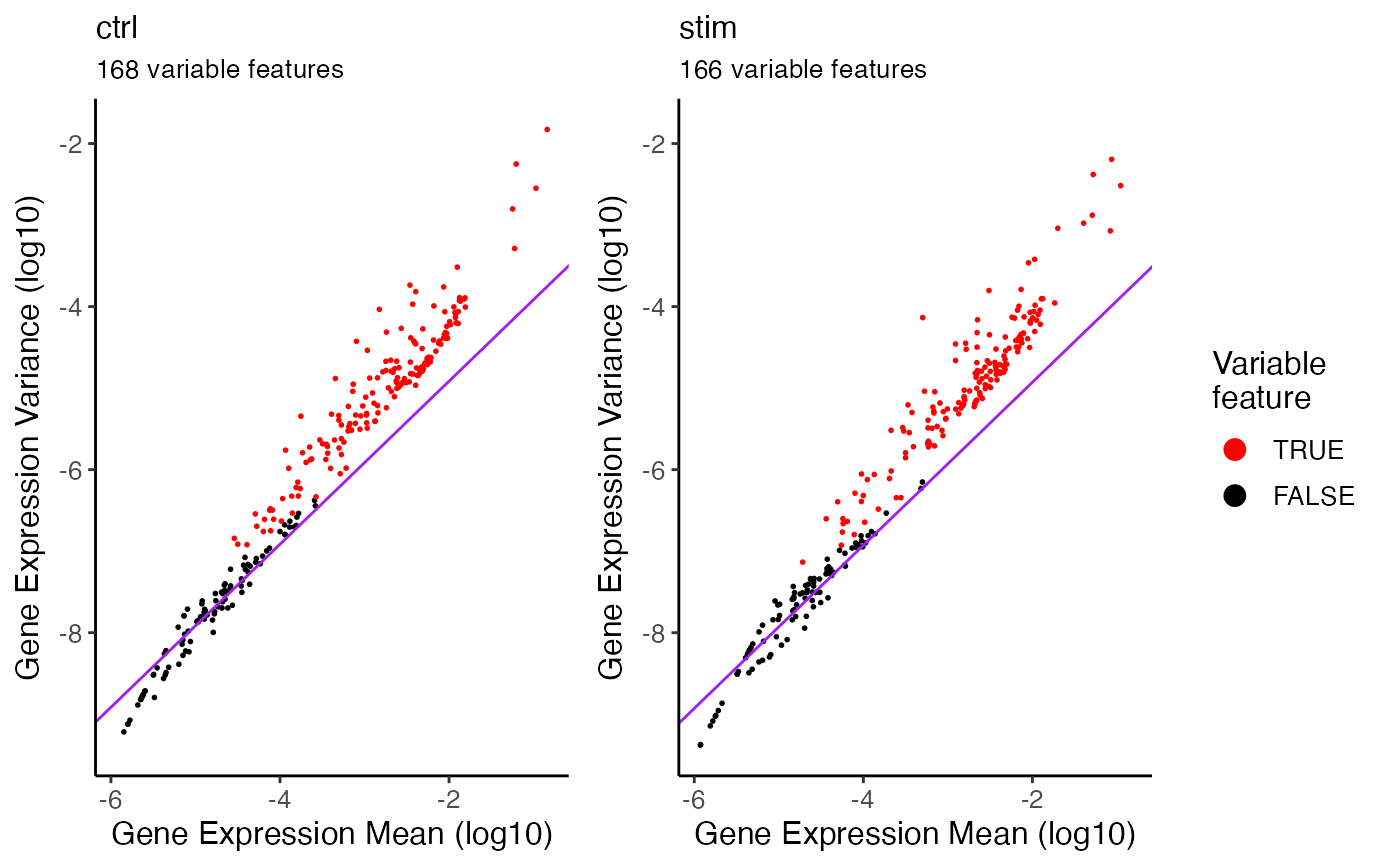
For each dataset where the feature variablitity is calculated, a plot of log10 feature expression variance and log10 mean will be produced. Features that are considered as variable would be highlighted in red.
Arguments
- object
liger object.
selectGenesneeds to be run in advance.- combinePlot
Logical. If
TRUE, sub-figures for all datasets will be combined into one plot. ifFALSE, a list of plots will be returned. DefaultTRUE.- dotSize
Controls the size of dots in the main plot. Default
0.8.- ...
More theme setting parameters passed to
.ggplotLigerTheme.
Examples
pbmc <- normalize(pbmc)
#> ℹ Normalizing datasets "ctrl"
#> ℹ Normalizing datasets "stim"
#> ✔ Normalizing datasets "stim" ... done
#>
#> ℹ Normalizing datasets "ctrl"

#> ✔ Normalizing datasets "ctrl" ... done
#>
pbmc <- selectGenes(pbmc)
#> ℹ Selecting variable features for dataset "ctrl"
#> ✔ ... 168 features selected out of 249 shared features.
#> ℹ Selecting variable features for dataset "stim"
#> ✔ ... 166 features selected out of 249 shared features.
#> ✔ Finally 173 shared variable features are selected.
plotVarFeatures(pbmc)
