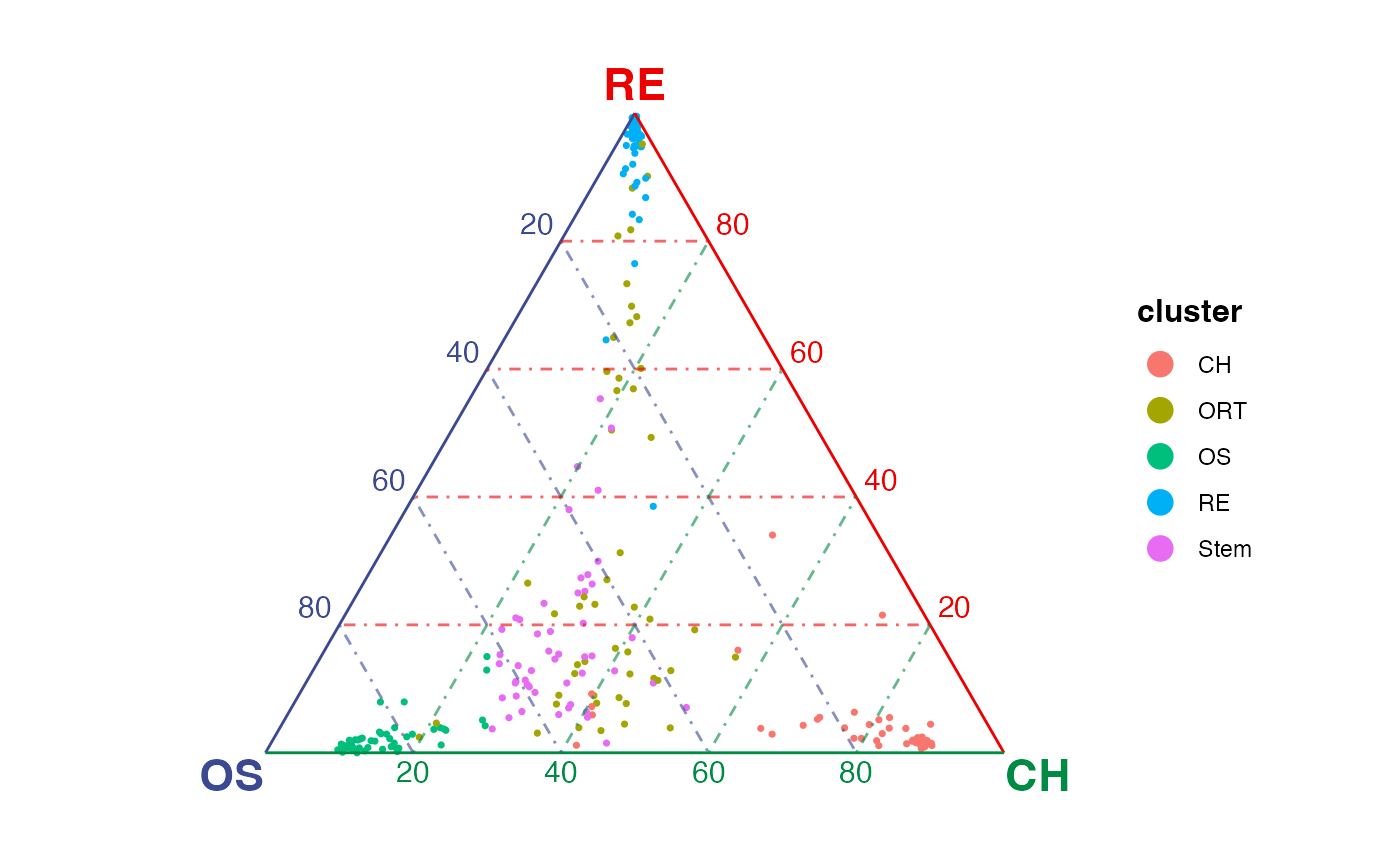
Create ternary plots that show similarity between single cells and selected three terminals in a ternary baricentric coordinate.
Usage
plotTernary(x, ...)

# Default S3 method
plotTernary(
  x,
  clusterVar,
  vertices,
  features = NULL,
  veloGraph = NULL,
  byCluster = NULL,
  processed = FALSE,
  method = c("euclidean", "cosine", "pearson", "spearman"),
  force = FALSE,
  sigma = 0.08,
  scale = TRUE,
  dotColorBy = NULL,
  dotColor = NULL,
  palette = "D",
  direction = 1,
  breaks = NULL,
  legendTitle = NULL,
  returnData = FALSE,
  ...
)
Arguments
- x
Input data. Can be a
matrixordgCMatrixobject with cells as columns, aSeuratorSingleCellExperimentobject. "simMat" method takes intermediate values.- ...
Arguments passed on to
plotTernary.simMattitleTitle text of the plot. Default
NULL.nGridNumber of grids along the bottom side of the equilateral triangle. Default
10.radiusArrow length of unit velocity. Lower this when arrows point outside of the coordinate. Default
0.1.dotSizeDot aesthetics passed to
geom_point. Default0.6when not interactive,4when interactive.dotShuffleWhether to shuffle the order of dots being added to the plot, useful when categorical colors are used and mixing of categories is expected. Default
NULLdoes shuffle whendotColorBygiven is categorical and does not otherwise.labelColorsColors of the axis lines and vertex labels. Default
c("#3B4992FF", "#EE0000FF", "#008B45FF")(blue, red and green)vertexLabelSizeSize of vertex labels. Default
6when not interactive,16when interactive.vertexLabelDriftPosition adjustment of the vertex labels, only applied to non-interactive view. Default
0.03.axisBreakNumber of breaks to be labeled along axis. Default
5.axisTextShowLogical, whether to show axis text. Default
TRUE.axisTextSizeSize of text along each axis break. Default
4for non-interactive view,12for interactive view.axisTextDriftPosition adjustment of the axis text, only applied to non-interactive view. Default
0.01.gridLineAlphaTransparency of background grid lines. Default
0.6.arrowLinewidthLine width of the velocity arrows. Default
0.25for non-interactive view,2for interactive view.arrowAngleControls the angle of the arrowhead, only applied to non-interactive view. Default
20.arrowLenControl length in centimetre from arrow tip to arrow tail, only applied to non-interactive view. Default
0.2.titleSizeSize of title text. Default
14for non-interactive view,20for interactive view.equilateralLogical, whether to always display the triangle as equilateral. Default
TRUE.marginMargin allowed around of the triangle plotting region when
equilateral = TRUEinteractiveLogical. Whether to display plotly interactive view. Default
FALSE.
- clusterVar
A vector/factor assigning the cluster variable to each column of the matrix object. For "Seurat" method,
NULL(default) forIdents(x), or a variable name inmeta.dataslot. For "SingleCellExperiment" method,NULL(default) forcolLabels(x), or a variable name incolDataslot.- vertices
Vector of three unique cluster names that will be used for plotting. Or a named list that groups clusters as three terminal vertices. There must not be any overlap between groups.
- features
Valid matrix row subsetting index to select features for similarity calculation. Default
NULLuses all available features.- veloGraph
Cell x cell
dgCMatrixobject containing velocity information. Shows velocity grid-arrow layer when specified. DefaultNULLdoes not show velocity.- byCluster
Default
NULLto generate one plot with all cells. Set"all"to split cells in plot by cluster and returns a list of subplots for each cluster as well as the plot including all cells. Otherwise, a vector of cluster names to generate a list of subplots for the specified clusters.- processed
Logical. Whether the input matrix is already processed.
TRUEwill bypass internal preprocessing and input matrix will be directly used for similarity calculation. DefaultFALSEand raw count input is recommended. If missing in call, usingslot = "counts"in "Seurat" method or usingassay.type = "counts"in "SingleCellExperiment" method will force this argument to beFALSEand others forTRUE.- method
Similarity calculation method. Default
"euclidean". Choose from"euclidean","cosine","pearson","spearman".- force
Whether to force calculate the similarity when more then 500 features are detected, which is generally not recommended. Default
FALSE.- sigma
Gaussian kernel parameter that controls the effect of variance. Only effective when using a distance metric (i.e.
methodis"euclidian"or"cosine"). Larger values tighten the dot spreading on figure. Default0.08.- scale
Whether to min-max scale the distance matrix by clusters. Default
TRUE.- dotColorBy
A vector/factor for coloring dots, can be either categorical (must be character or factor) or continuous. Default
NULL.- dotColor
Character vector of color codes. When
dotColorByisNULL, use one or as many colors as the number of cells. IfdotColorByis categorical, specify as many colors as the number of categories indotColorByor ggplot2 categorical color palette is used by default. IfdotColorByis continuous, specify together withbreaksargument.- palette
Color palette to use when
dotColorByis given. Default"D"(viridis) for continuous value and ggplot2 default for categorical value. See detail for alternatives.- direction
Sets the order of colors in the scale. Default
1orders as palette default. If-1, the order of colors is reversed.- breaks
Number of breaks for continuous color scale passed to non-interactive "plot3D::scatter3D" call. Default
NULL.- legendTitle
Title on the legend/colorbar. Default
NULLuses"cluster"ifdotColorByis missing (default); user-end variable expression ifdotColorByis directly specified from plotQuaternary.default method; variable name ifdotColorByis specified from Seurat or SingleCellExperiment method.- returnData
Logical. Whether to return similarity and aggregated velocity data if applicable instead of generating plot. Default
FALSE.
Value
By default, a "ggplot" object when byCluster is not specified,
a list of "ggplot" object when byCluster is specified. When
interactive = TRUE, a "plotly" object is returned. When
returnData = TRUE, a list of similarity matrix and aggregated velocity
matrix is returned.
Details
Argument inheritance - For matrix/dgCMatrix ("default" method), we first calculate the similarity matrix and obtain a "simMat" object. Then the "simMat" method is internally called. For data container objects (e.g. Seurat), we obtain the correct data matrix first and then call the "default" method. The arguments inherits as the flow described above.
The calculation of similarity matrix - The similarity is calculated either by converting a distance metric ("euclidean" or "cosine") with Gaussian kernel, or directly computed with correlation metrics ("pearson" or "spearman"). The centroid of each terminal is obtained first, and the specified metric from each cell to each terminal is calculated. The similarity matrix (n cells by v terminals) is lastly normalized to sum to 1 for each cell, so it becomes a baricentric coordinate.
See also
Other plotTernary:
plotTernary.Seurat(),
plotTernary.SingleCellExperiment()
Examples
gene <- selectTopFeatures(rnaRaw, rnaCluster, c("OS", "RE", "CH"))
#> Selected 30 features for "CH".
#> Selected 30 features for "OS".
#> Selected 30 features for "RE".
plotTernary(rnaRaw, rnaCluster, c("OS", "RE", "CH"), gene)